Cumulative economic impact of future trade agreements on EU agriculture
In July 2019, following the political conclusion of the EU-Mercosur Free Trade Agreement (FTA), former Commissioner Hogan, the then Commissioner for Agriculture and Rural Development, announced at the Agriculture Council an update of the 2016 Cumulative impact study, covering the economic aspects of agricultural tariff reduction. This was reiterated by Agriculture Commissioner Wojciechowski at his confirmation hearings.
The report was presented to the Agriculture Council on the day it was published (25 January 2021).
This interactive infographic complements the homonym scientific report with tools to freely dig in data visualizations and to discover facts within the model results.
FTA impact 2030
Scenarios side by side
In this section you can vizualize side-by-side the projected value for 2030 of the trade flows between EU and the 18 countries/regions subject of on-going or concluded negotiations of free trade agreement.
These visualizations show absolute projected values: please remind that the focus should be put in the differences among the scenarios. Reliability of absolute values is declaredly unpredicatable.
Import: What EU would import in 2030.
Export: What EU would export in 2030.
Trade Balance: EU exports - EU imports in 2030.
Trade map
Commodities
Change in EU market balance
Value of EU production by agricultural commodity and scenario
The study

Building on and updating a previous study published by the European Commission’s Joint Research Centre (JRC) in 2016, the present report analyses the cumulative economic impact on the EU agricultural sector of potential concluded and negotiated Free Trade Agreements (FTAs) between the EU and 12 trade partners (Australia, Canada, Chile, Indonesia, Japan, Mercosur, Mexico, Malaysia, New Zealand, Philippines, Thailand and Vietnam).
At time the study is carried out (February-November 2020) negotiations were concluded for the EU trade agreements with Canada, Mercosur, Mexico, Japan and with Vietnam while other trade dossiers are under negotiation, just launched or likely to be launched in the near future.
In 2016, JRC published a study analysing the cumulative economic impact of potential ongoing and upcoming Free Trade Agreements between the EU and 12 trade partners (USA, Canada, Mercosur, Australia, New Zealand, Japan, Vietnam, Thailand, Turkey, Mexico, Philippines and Indonesia) on the EU agricultural sector. The study analysed two theoretical trade scenarios, defined in function of different levels of ambition in the negotiations, named as conservative and ambitious. Overall, the results show relatively balanced cumulated impacts in terms of trade, production and producer prices, for the EU agricultural sector as a whole.
The represent study, building on the one presented in 2016, differs from its predecessor in some crucial points making a full comparison between the two difficult.
The main differences between the two studies are the following:
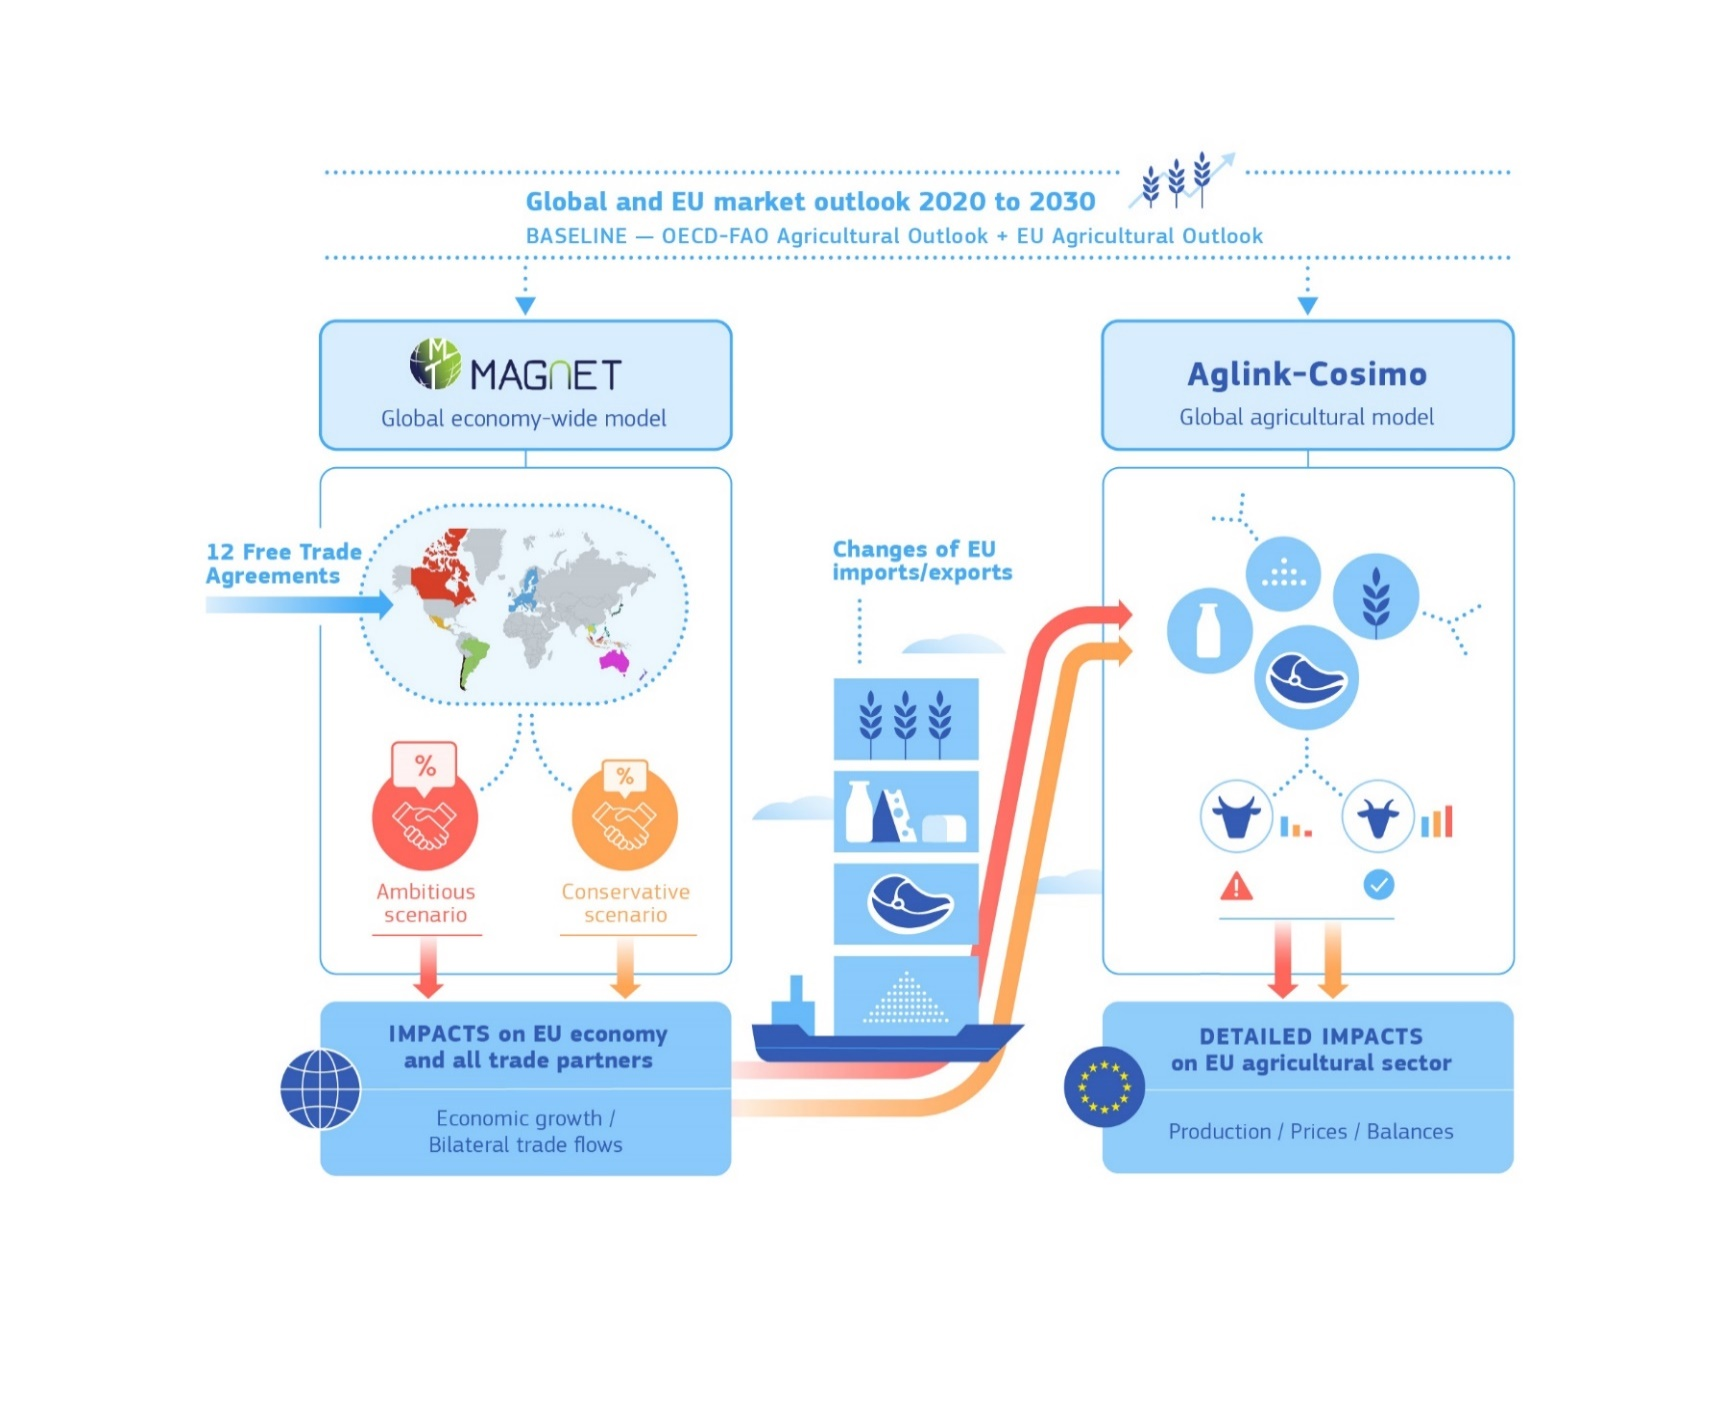
The economic assessment is based on a two-tier modelling approach:
- An analysis of the impacts of the 12 FTAs on the EU agri-food trade flows, performed by means of simulations with the MAGNET model, a global computable general equilibrium model (CGE).
- A detailed analysis of the impacts on EU agriculture at product-specific level, run by means of the partial equilibrium model (PE) Aglink-Cosimo.
The two models operate in an integrated manner, exploiting their respective strengths. MAGNET is calibrated to the EU Outlook 2019 medium-term projections derived from the Aglink-Cosimo model, the latter introduces the net trade shocks coming from the bilateral trade simulations provided by MAGNET. The analysis of bilateral trade flows and the extensive product coverage in MAGNET is combined with the detailed analysis of the impact on the EU agricultural sector in Aglink-Cosimo. Both models have a full global coverage but focus in this analysis on the EU perspective.
You can find deep details about the adopted methodology in the scientific report.
The models base their calculations by considering the overall World economy.
Besides the EU and the 12 FTA countries and regions that are the subject of the study (labelled as "12 FTA), the rest of the world (EU-27 itself and "Other Countries" regions) is considered in the model's computations and organized in macro regions.
In this map you can see the FTA partners and in grey all the other countries. European Union is in blue. The regions are separated by borders. If you leave the mouse over a region, the region name appears. If you zoom the map (i.e.: with the mouse wheel) you can see what are the countries included in the regions in the background.
Computed general equilibrium (CGE) models considers the whole economy.
The MAGNET model has a comprehensive coverage of the economy, and thus of the agri-food sector among all the rest. However, the level of product disaggregation, despite improved compared to the previous study, is quite limited as well as its capacity to model sectorial specificities and policy constraints.
The partial equilibrium model Aglink-Cosimo overcomes these shortcomings and provides more detailed and comprehensive results at agricultural commodity level, although it cannot provide results for specific dynamics relating to certain product segments. Furthermore, the product-coverage of Aglink-Cosimo is not exhaustive, as it does not model some important agricultural products such as fruit and vegetables, wine, olive oil and processed agricultural products in general which represent a significant share of total EU agri-food export value.
In this table you have a resume of the economic sectors processed in one or both of the models, and what is ultimately present in the results, which focus on agriculture and food commodities.
| MAGNET | Aglink-Cosimo |
|---|---|
| Wheat | Soft wheat |
| Durum wheat | |
| Grains | Barley |
| Maize | |
| Oats | |
| Rye | |
| Other cereals | |
| Paddy rice | Rice |
| Processed rice | |
| Oilseeds | Soybean |
| Rapeseed | |
| Oils & meals | Rapeseed meal |
| Soybean meal | |
| Sunflower meal | |
| Rapeseed oil | |
| Sunflower oil | |
| Palm oil | |
| Sugar beet | Not modelled at trade level |
| Sugar | White sugar |
| Raw Sugar | |
| Fruits and vegetables | Not modelled |
| Other crops | Not modelled |
| Live animals (cattle) | Cattle |
| Live animals (sheep, goat, …) | Sheep |
| Bovine meat | Beef & Veal |
| Sheep (and other red) meat | Sheep and goat meat |
| Live pigs and other animal products | Swine |
| Live animals (chicken) | Poultry |
| Pig meat | Pig meat |
| Poultry meat | Poultry meat |
| Raw milk | Not modelled at trade level |
| Dairy products | Butter |
| Cheese | |
| Skimmed milk powder | |
| Whole milk powder | |
| Wye powder | |
| Other food | Not modelled |
| Beverages | Not modelled |
The results presented here, are the projections of the EU import and exports of agriculture and food products to worldwide partners (countries or macro-regions) and the expected level of the EU production. The Baseline represents what would happen if nothing changes in terms of trade policy.
The study considers two trade liberalisation scenarios, one more ambitious, one more conservative, and compares them with the situation in 2030 without the implementation of the selected FTAs (baseline).
In both scenarios, concluded negotiations (with Canada, Japan, Vietnam, Mercosur and Mexico) are modelled based on their actual outcome, in terms of tariff concessions and bilateral TRQs. This allows the models to reflect more closely the expected impact of those agreements compared than in the 2016 study, which considered theoretical scenarios for all agreements except Vietnam and Canada.
For the other FTAs covered (with Australia, Chile, Indonesia, Malaysia, New Zealand, Philippines and Thailand), the following theoretical concessions are implemented:
1) In the ambitious scenario, full tariff liberalisation for 98.5% of HS 6-digit lines, and a partial tariff cut of 50% for the other lines (sensitive products);
2) In the conservative scenario, full tariff liberalisation of 97% of HS 6-digit lines and a partial tariff cut of 25% for the other lines (sensitive products).
These are mere modelling exercises and should not in any way be seen as prejudging the potential outcome of the ongoing negotiations.
Although economic models used in this study can be used to project individual values of particular variables, it must be stressed that they are not forecasting models and users should be aware that the particular values projected for, say, 2030 may be unreliable as to what will happen in that year.
However, the simulated impact of a particular policy change in 2030, relative to the 'no change' situation, or relative to another year, is more likely to be reliable since the influences of any imperfections in the model and of unforeseen external shocks may be cancelled out across the two scenarios (or years) being compared, leaving a deviation between the two that has a lower component of error.
That is why the below visualizations allow you to study differences:
1) Assesing the impact of the free trade agreement in 2030 by comparing the two scenarios (conservative and ambitious), against the 'no change situation' (baseline).
2) By comparing the changes between 2030 and 2020 by scenario.
3) By visualizing the results of the 3 scenarios side-by-side.
One of the main limitations of the study relates to the coverage of agricultural products in the economic models used. The CGE model MAGNET has a comprehensive coverage of the economy, and thus of the agri-food sector. However, the level of product disaggregation, in particular for the processed food sectors, is quite limited. The partial equilibrium model Aglink-Cosimo provides more detailed results at agricultural commodity level, although the product-coverage of Aglink-Cosimo is not exhaustive, as it does not model some important agricultural products such as fruits and vegetables, wine, olive oil and processed agricultural products in general.
As regards the geographical disaggregation of the study, results are provided only for the EU as a whole, given the complexity of the analysis.
Furthermore, the trade considered scenarios investigate the effects of tariff liberalisation but do not factor in the analysis the possible reduction of non-tariff measures (NTMs). Since there are currently no reliable estimates of NTMs for the agricultural sector at disaggregated level, and given the limited time to complete the exercise, it was decided to omit them from the study.
The study adopted a purely technical assumption of a duty-free, quota free future trade relation with the UK.
Finally, accounting for the impacts of the COVID-19 pandemic, the impact of the European Green Deal and other relevant factors related to trade policies such as environmental and social sustainability falls beyond the scope of the study.
For the EU agricultural sector as a whole, the results show relatively balanced cumulated impacts in terms of trade. Increases in exports and imports are comparable with a slight higher impact on exports, and moderate impacts on production and producer prices. The impact on the overall EU agri-food trade balance is nevertheless positive, thanks to the capacity of the EU to strongly increase its exports performance (+30% exports in the ambitious scenario compared to +14.9% imports).
The study confirms the results of the 2016 study, notably as regards the sensitivity of specific sectors, albeit with more moderate impacts due notably to the possibility of reflecting the concrete outcome of concluded agreements, and the capacity to model TRQs granted in this context. It is consistent with the expectation that providing increased market access in the form of tariff rate quotas (rather than mere tariff cuts) for the most sensitive products enables the EU to protect the related sectors.
Lastly, the study highlights the positive impact of the trade agreements for the EU’s trade partners. They increase their share of the EU market at the expense of other trade partners.
The ambitious and the conservative scenarios present limited differences in terms of impacts. This is because most of the market access increase is attributable to the concluded FTAs, which cover the biggest trade partners of the selection of 12 FTAs (Mercosur, Canada, Japan and Vietnam). This increase is almost identical in both scenarios as the concessions modelled are unchanged. The additional market access enjoyed by the other FTA partners (Australia, New Zealand, Thailand etc.) in the ambitious scenario compared to the conservative one is relatively small overall. The situation varies however between agricultural sectors, e.g. the difference between the two scenarios is significant for the sheep sector, as the main trade partners concerned are Australia and New Zealand and for the rice sector, where Thailand plays a prominent role.
This infographic is a complement of a Science for Policy report by the Joint Research Centre (JRC), the European Commission's science and knowledge service.
It aims to provide evidence-based scientific support to the European policy-making process. The scientific output expressed does not imply a policy position of the European Commission.
Neither the European Commission nor any person acting on behalf of the Commission is responsible for the use, which might be made of this infographic and underlying data.
AVE - Ad Valorem Equivalent
CAP - Common Agricultural Policy
CETA - Comprehensive Economic and Trade Agreement
CGE - Computable General Equilibrium
DG - AGRI - Directorate-General for Agriculture and Rural Development
DG - TRADE - Directorate-General for Trade
EC - European Commission
EU - European Union
FAO - Food and Agriculture Organization of the United Nations
FTA - Free Trade Agreement
F&V - Fruits and Vegetables
GDP - Gross Domestic Product
GTAP - Global Trade Analysis Project
HS - Harmonised System (tariff nomenclature)
iMAP - integrated Modelling Platform for Agro-economic Commodity and Policy Analysis
JRC - Joint Research Centre
MAGNET - Modular Applied GeNeral Equilibrium Tool
MERCOSUR - Mercado Común del Sur
NTM - Non-Tariff Measure
OECD - Organisation for Economic Co-operation and Development
TBT - Technical Barriers to Trade
PE - Partial Equilibrium
SIA - Sustainability Impact Assessment
SMP - Skimmed Milk Powder
SPS - Sanitary and Phytosanitary Measures
TASTE - Tariff Analytical and Simulation Tool for Economists
TRQ - Tariff Rate Quota
TTIP - Transatlantic Trade and Investment Partnership
WMP - Whole Milk Powder
WTO - World Trade Organisation