Food and nutrition security in long-term projections
This interactive infographic illustrates the results of a study that estimates the future of global food and nutrition security up to 2050, while taking into account trade-offs with environmental sustainability.
Home
The study was developed in the context of the FOODSECURE interdisciplinary research project exploring the future of global food and nutrition security.
The FOODSECURE project has received funding from the European Union’s Seventh Framework Programme (FP7) for research, technological development and demonstration.
The Joint Research Centre (JRC) of the European Commission is a contributor to the project, and among other work, has developed this infographic as a complement to the scientific article of Meijl, Hans van, Lindsay Shutes, Hugo Valin, Elke Stehfest, Michiel van Dijk, Marijke Kuiper, Andrzej Tabeau, Willem-Jan van Zeist, Tomoko Hasegawa, and Petr Havlik. "Modelling Alternative Futures of Global Food Security: Insights from FOODSECURE." Global Food Security 25 (June 1, 2020): 100358. https://doi.org/10.1016/j.gfs.2020.100358.
The study is based on the results of two economic and biophysical modelling frameworks, MAGNET-IMAGE and GLOBIOM, and simulates four scenarios differentiated by the degree of inequality and sustainability.
The study is the outcome of joint research by Wageningen Economic Research, IIASA and PBL Netherlands Environmental Assessment Agency. The contributions of the FOODSECURE stakeholder group to the scenario exercise are gratefully acknowledged.


The study
Overview
Since the high food price peaks of 2008 and 2011, there has been increased focus on the state of food and nutrition insecurity around the world.
To address this concern, a number of systems have been introduced to monitor the state of food and nutrition security.
This study examines developments in food and nutrition security in four stakeholder-defined futures through a range of commonly used food and nutrition security indicators.
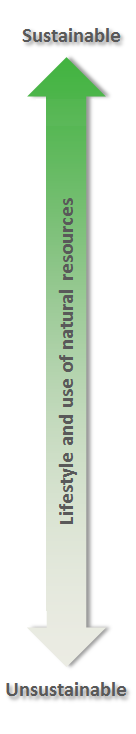
The scenarios are differentiated by the degree of inequality on one axis and sustainability on the other.
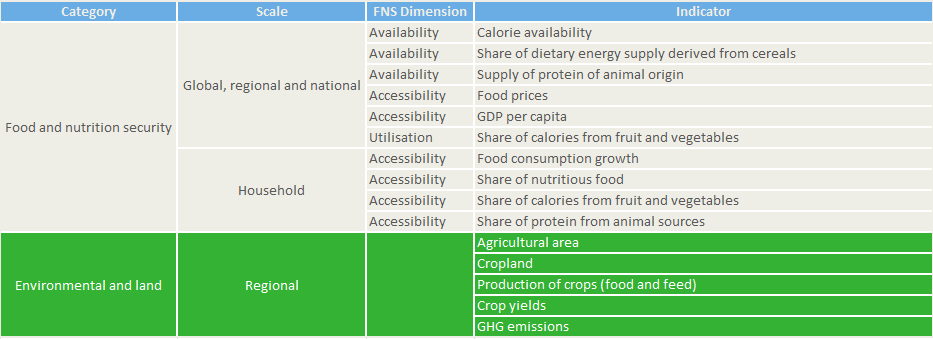
The indicators are selected to cover as many of the dimensions of food and nutrition security as possible (see picture on the side).
The analysis is complemented with an assessment of the possible trade-offs between food and nutrition security and sustainability in each of the worlds.
Indicators
Lele et al.(2016) - identify over 150 indicators of food and nutrition security of which 100 are in use by international organisations.
In this study a suite of ten metrics for measuring food and nutrition security in long-term projections is used, together with a number of environmental indicators.
The metrics are familiar as they are largely based on the FAO set of FNS indicators (FAO, 2016) and cover macro nutrients, food prices and growth.
Regions
This study evaluates food and nutrition security globally and by developing regional groupings; it then digs deeper into the implications for the poor in 5 focus countries (China, Ghana, Indonesia, India, Uganda)
Models
The toolbox used in this study comprises three models: an economy-wide general equilibrium (CGE) model, MAGNET, an agriculture-focused partial equilibrium (PE) model, GLOBIOM, and a biophysical model, IMAGE.
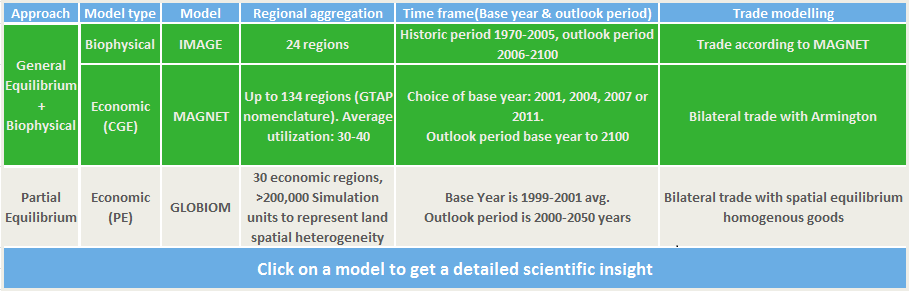
The IMAGE model contributes to the study using a biophysical approach while GLOBIOM and MAGNET contribute via an economic approach. The combination of biophysical, partial equilibrium and general equilibrium models with different levels of aggregation ensures that the questions of interest for the project are tackled at the most appropriate level of detail.
GLOBIOM
The Global Biosphere Management Model (Havlík et al. 2014) is a global recursive dynamic partial equilibrium model of the forest and agricultural sectors, where economic optimization is based on the spatial equilibrium modelling approach (Takayama and Judge, 1971).
The supply side of the model is based on a bottom-up approach (from land cover, land use, and management systems to production and markets).
The agricultural and forest productivity is modeled at the level of grid cells of 5x5 to 30x30 arcminutes, using biophysical models, such as EPIC (Williams, 1995), while the demand and international trade occur at the regional level (from 30 to 53 regions covering the world, depending on the model version and research question).
Besides primary products, the model has several final and by-products, for which the processing activities are defined.
The model computes market equilibrium for agricultural and forest products by allocating land use among production activities to maximize the sum of producer and consumer surplus, subject to resource, technological and policy constraints.
The level of production in a given area is determined by the agricultural or forestry productivity in that area (dependent on suitability and management), by market prices (reflecting the level of demand), and by the conditions and cost associated to conversion of the land, to expansion of the production and, when relevant, to international market access.
Trade flows are balanced out between different specific geographical regions.
Trade is furthermore based purely on cost competitiveness as goods are assumed to be homogenous.
This allows tracing of bilateral trade flows between individual regions.
By including not only the bioenergy sector but also forestry, cropland and grassland management, and livestock management, the model allows for a full account of all agriculture and forestry GHG sources.
GLOBIOM accounts for ten sources of GHG emissions, including crop cultivation N2O emissions from fertilizer use, CH4 from rice cultivation, livestock CH4 emissions, CH4 and N2O emissions from manure management, N2O from manure applied on pasture, and above and below ground biomass CO2 emissions from biomass removal after converting forest and natural land to cropland.
MAGNET
The MAGNET model (Woltjer et al., 2014) is a GTAP-based model that has a modular structure and is flexible in regional and commodity aggregation that allows the model to be tailored to specific research questions such as the impact of the biobased economy (by including the biofuel and land modules) or the impact of Common Agricultural Policy (by including CAP module).
The MAGNET model is a multi-regional, multi-sectoral, applied general equilibrium model based on neo-classical microeconomic theory (Nowicki at al., 2007, Nowicki at al., 2009 and van Meijl et al., 2006, Woltjer et al., 2014).
It is an extended version of the standard Global Trade Analyses Project (GTAP) model (Hertel, 1997).
MAGNET assumes perfect competition, namely producers are price takers where, in order to produce output, they choose the cheapest combination of imperfectly substitutable labour, capital, land, natural resources and intermediates.
At the core of MAGNET is an input–output model, which links industries in value added chains from primary goods, over continuously higher stages of intermediate processing, to the final assembly of goods and services for consumption.
Input and output prices are endogenously determined by the markets so as to achieve supply and demand equilibrium. Households are assumed to distribute income across savings and (government and private) consumption expenditures according to fixed budget shares following a Cobb-Douglas (CD)expenditure function.
Private consumption expenditures are allocated across commodities by introducing a richer representation of income effects in the demand system.
In particular, marginal budget shares vary with the expenditure level using a non-homothetic constant differences of elasticity (CDE) expenditure function1.
Government consumption is allocated across commodities according to fixed budget shares using a CD expenditure function.
Labour, capital and natural resources are fully employed in each region and the aggregated supply of each factor equals its demand (equilibrium).
Thus factor markets are competitive between sectors but not between regions.
MAGNET assumes that that products traded internationally are differentiated by country of origin following the Armington assumption.
This assumption generates smaller and more realistic responses of trade to price changes than implied by models of homogeneous products (Armington, 1969).
IMAGE
The IMAGE model is an impact assessment model with a strong biophysical component, which can be used independently or in conjunction with a global CGE model such as MAGNET.
The Integrated Model to Assess the Global Environment (IMAGE) framework (Stehfest et al. 2014) describes various global environmental change issues using a set of linked submodels describing the energy system, the agricultural economy and land use, natural vegetation and the climate system.
The socio-economic models distinguish 26 world regions, while the models for land use and terrestrial ecosystems mostly work at a 5x5 minutes and 30x30 minutes grids.
Agricultural demand, production and trade are modelled via the MAGNET model (Woltjer et al. 2014), which is integral part of the IMAGE framework in most scenario studies.
The use of bio-energy plays a role at several components of the IMAGE system.
The resulting agricultural intensification and regional production determine future land use.
In allocation the regional production to the grid scale, potential yields according to LPJml model are used, together with other suitability considerations.
LPJmL is an integral, dynamically coupled part of IMAGE, and computes agricultural yields, the Carbon and Water Cycle in all terrestrial systems.
Finally, emissions associated with land use and land-use change and the energy system are used in the climate model (MAGICC-6) to determine climate change, which then affects all biophysical sub-models.
Scenarios
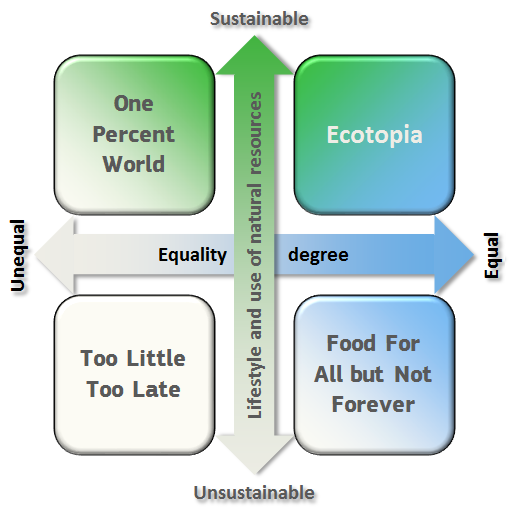
The four future worlds depicted in the FOODSECURE scenarios were developed through a participatory process involving stakeholders including policy makers, researchers, experts in scenario analysis and high level representatives from business with an interest in food security issues.
The process resulted in four scenarios of the future, grouped along two dimensions of equality and sustainability: a sustainable but unequal world in One Percent World, a sustainable and equal world in Ecotopia, an equal but unsustainable world in Food For All but Not Forever and an unsustainable and unequal world in Too Little Too Late.
In the below picture click on the icons to get a detailed description of each scenario, click again to the visualized scenario to return to the assumptions table
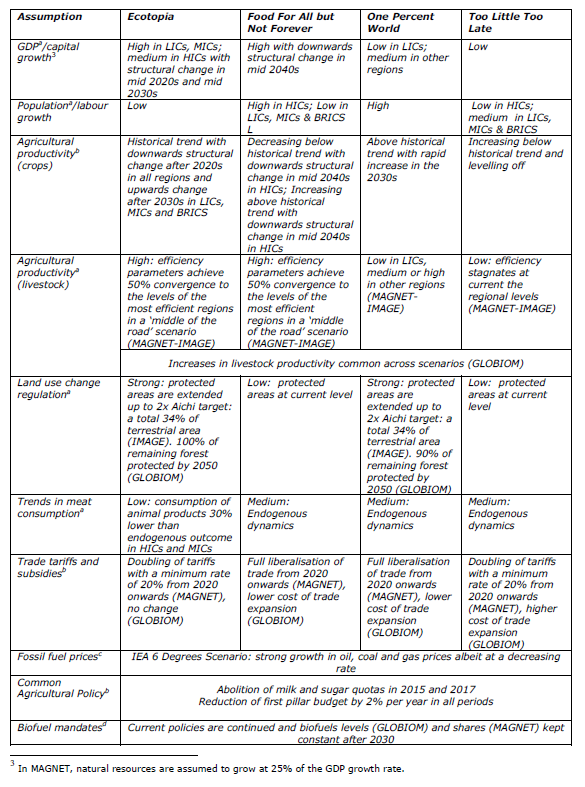
One Percent World (ONEPW)
Investment in technology in hands of happy few, acting in the interest of the community.
In the One Percent World scenario, global wealth is very unequally distributed. An elite group of ‘new rich’ – that constitutes around one per cent of total population – controls the major corporations dominating the majority of markets and owning most of natural resources.
The greater part of the resources, in particular water and land, is located in developing countries.
The scarcity of resources in these countries has increased considerably over the past forty years. Authority and power are shifted from the government to the elite.
Governments have cut budgets and reduced the expenditures in public services, which are mostly replaced by private services, mainly geared towards the needs of the elite.
The elite are highly educated and trained. To protect their assets, they invest in research and development to create private solutions for global environmental problems.
The results of the investments are a number of path-breaking technologies to overcome the problems of climate change, reduce pollution and waste and protect the environment.
Other technological advances have resulted in much higher crop yield to ensure the efficient and low-cost production of food.
A lot of the advanced technology put in place requires minimum skill levels from employees handling the technology.
The food and nutrition security is ensured for the elite in the One Percent World scenario. The rest 99% of people are fed, since the quantity of food has been provided through high efficient and technologically advanced production systems. However, the nutritional quality of the staple food is questionable, especially regarding micronutrients.
Ecotopia (ECO)
Lower but more inclusive growth. Reduced consumer aspirations of elite consumers, behaviour change.
The Ecotopia scenario assumes an equal society, in which all people are well educated and wealth is equally distributed.
Free movement of people is guaranteed.
Local policies support development of rural areas.
New agricultural production technologies are developed that focus on sustainability and zero waste.
Urban agriculture is highly developed and aquaculture is sustainable.
New and diversified renewable energy sources are applied, which replace conventional fossil fuel energy sources.
Environmental and agricultural innovations are accessible for everybody due to their open source nature.
Trade policies are aligned to food and nutrition security and stable ecosystems.
The global population has access to sustainable diets.
Water and food choices and basic needs are covered.
All food is safe and there are new sources of food available and socio-cultural aspects are respected in the diet.
The concept of "prosumers" is introduced, where and consumers of food are at the same time also producers of food.
In the Ecotopia scenario therefore the problem of food and nutritional security has been solved by 2050.
Food For All but Not Forever (FFANF)
A kickback from unsustainable use of resources leading to environmental breakdown and high costs of inaction.
In this scenario consumption and growth are more important than sustainability in the mindset of the global population.
The rapid economic and employment growth, accompanied by more intensive multilateral international co-operation, has led to free movement of goods and people, better health and education systems, more democracy and eradication of hunger.
Wealth is more equally distributed and poverty has been reduced, since countries have adopted taxation systems to equalize incomes and property within societies.
At the same time, the environment is on the brink of catastrophe.
The climate change problem has worsened: over the last years, the global economy has been severely suffering from climate induced disasters, such as hurricanes, floods and droughts.
This happened as a consequence of the use of more and cheaper fossil fuels and less renewable resources, as well as due to the shift to intensive, but polluting agricultural systems.
The overuse of pesticides and fertilizers has substantially decreased soil fertility on all continents across different ecosystems.
The rainforest has largelybeen destroyed and replaced by farm land.
Food production systems have intensified to the point that pandemics have broken out in the livestock sector.
The food and nutrition security is this scenario has been achieved, but in an unsustainable way (i.e. over-intensification of food production systems).
On global level, the problem of malnutrition has been solved, as well as micronutrient deficiencies (due to government interventions).
However, the shift to synthetic food was a necessary measure resulting from the collapse of natural food production systems.
Too Little Too Late (TLTL)
Stagnation, fragmentation, environmental crisis, continuation of rising inequalities and lack of innovation
In the Too Little Too Late scenario, several new financial crises have resulted in a sharp decrease in economic growth.
This situation has sparked national political crises, which in turn has given room for opportunistic behavior.
Governance at the international level has also worsened: in 2050, there is no international cooperation and the whole UN system has dissolved.
All of this has led to an unequal society, which consists of the "haves" and the "have nots", with the gap between the two groups widening over time.
A selected elite group ("the haves") holds the power and protects own interests, while the majority of people (the "have nots") is poor with limited access to food, health and education.
There is monopolized access to knowledge and technology: the rich have access to modern technologies, while the poor do not.
At the same time, the destructive effects of climate change, caused by uncontrolled depletion of (fossil) natural 12 resources, caused biodiversity loss, an increase in natural disasters, and disputes about water.
Regarding food and nutrition security, only the small minority of the "haves" benefits from food produced in a very unsustainable way, while the majority suffers from food and nutrition insecurity.
Findings
Limitations
This study is subject to some caveats.
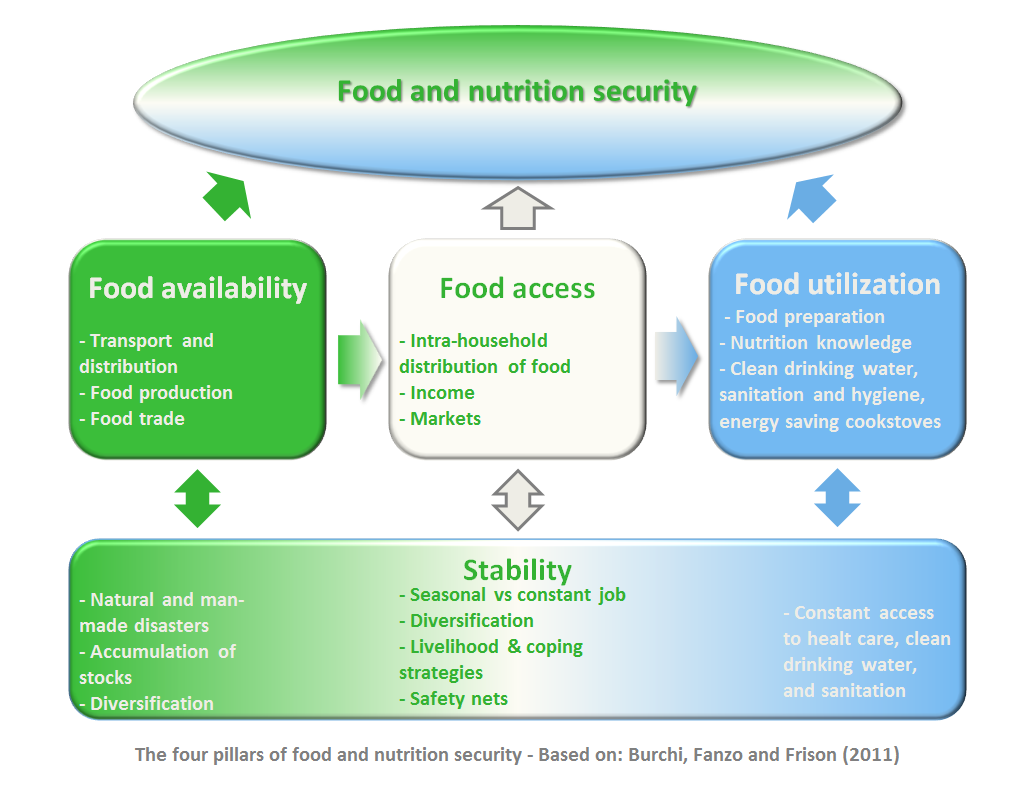
The indicators cover three of the four dimensions of FNS (availability, accessibility and utilisation) over multiple scales. The stability dimension is not captured due to the long-term nature of these models that cannot capture short-term fluctuations.
Although models used in this study are used to project individual values of particular metrics, it must be stressed that they are not forecasting models and users should be aware that the particular values projected for, say, 2050 may be unreliable as to what will happen in that year. However, the simulated impact of a particular set of assumptions in 2050, relative to another assumptions, or relative to another year, is more likely to be reliable since the influences of any imperfections in the model and of unforeseen external shocks may be cancelled out across the two scenarios (or years) being compared, leaving a deviation between the two that has a lower component of error.
Results in the two modelling approach may differ. A review of previous global modelling studies showed that results vary widely due to differences in (1) differences in scenario storylines and assumptions on drivers, (2) differences in the design of the models that are used to process the drivers and generate scenario outcomes, and (3) differences in the way and the extent to which results are reported (M. van Dijk and Meijerink 2014). To overcome some of these problems, several initiatives have emerged that aim to harmonise assumptions on drivers and systematically compare results across a suite of models.
Global Food and Nutrition Security
Global level: improvements in global food and nutrition security in most scenarios
Overall, global food security is set to improve in most scenarios. On average, calorie availability and income (GDP) per capita increase in all four scenarios, accompanied by a shift to more nutritious foods in all four worlds measured by a shift away from cereals in the diet. Food prices decrease in three out of four scenarios, TLTL being the exception. The other two indicators sketch a mixed picture. The supply of protein of animal origin, associated with a shift towards a diet with more meat is increasing in all worlds except for ECO due to assumed changes in diets. Although the consumption of more meat is less sustainable than other diets, it is likely to have a positive impact on food security in regions characterised by undernourishment, while the opposite is true for regions where obesity is a problem
Regional Food and Nutrition Security
Developing regions: greater improvements in Sub-Saharan Africa and South Asia in most scenarios
Most regional FNS indicators show an improvement across scenarios compared to the initial picture in 2010. There remains a large degree of variation between the four worlds with overall greater improvements in food and nutrition security in the ECO and FFANF scenarios and lower improvements in ONEPW and TLTL.
Food and nutrition security improves markedly in the relatively low income regions of Sub-Saharan Africa and South Asia in ECO, FFANF and ONEPW. Food availability increases, however the supply of protein from animal origin in both regions in 2050 remains low in absolute levels in comparison to the rich countries today, partly due to the lower importance of meat in the South Asian diet. Food accessibility also increases due to per capita income growth which is compounded by lower food prices in Sub-Saharan Africa, and offset by slightly higher food prices in South Asia. Food utilization improves in Sub-Saharan Africa but decreases in South Asia when consumption is shifted to other nutritious products. However, the latter result should be treated with caution as the models tend to disagree about the projections for fruit and vegetables consumption. In contrast to the other three scenarios, food and nutrition security is not or only very moderately improving in the TLTL world in these regions. Income per capita, calorie availability and diets improve only slightly, while at the same time access to food deteriorates due to steeply rising food prices.
Food and nutrition security in East Asia and Latin America and Caribbean, is relatively higher in 2010 in comparison to Sub-Saharan Africa. Food and nutrition security also improves up to 2050 in these regions in the ECO, ONEPW and FFANF scenarios but improvements are less dramatic than in the other two regions because of the higher base levels. Calorie availability increases to around 3,250 kcal per cap in both regions, which is comparable to the current level of Spain. Equally, the consumption of meat increases to around 45-50 grams/cap/day, which is close to many OECD countries. As basic needs are already fulfilled and relative income is high, consumers make the decision to have a more sustainable diet towards less meat in the ECO scenario. Food prices slightly increase in East Asia and decrease in Latin America and Caribbean. This is, however, expected to have limited impact on food security as consumers spend a relatively low share of their (high) income per capita on food items.
Household level Food and Nutrition Security
Household level: more food of higher quality for the poor in India, China, Indonesia and Uganda in all worlds
Real food consumption grows faster for the poor than the average household in all regions except Ghana suggesting reduced inequality in all scenarios in these countries. The greatest increases appear in either ECO or FFANF and the lowest in TLTL. The picture for Ghana is more bleak as the growth in food consumption of the poor lags behind average food consumption in all worlds due to the poor being locked in an agricultural sector that is shedding labour as it becomes more mechanised, leading to decreases in the unskilled agricultural wage.
The increases in food consumption translate into improvements in food quality for the poor in India, Indonesia and Ghana. The quality of the diet of the poor improves by more than the average in Ghana, even though the quantity of food in the diet increases by less. Diet quality improves in China in all worlds except ECO, where the reduction in meat consumption affects the overall consumption of nutritious food. The improvements in food quality are greatest in the ECO, FFANF and ONEPW scenarios and least in TLTL in India, Indonesia and Ghana. The shift away from meat in the diet in ECO in China means that the share of nutritious food is projected to fall in this scenario as consumers rely more on cereals for calories.
Despite showing some of the strongest pro-poor growth in food consumption between 2010-2050, the quality of the diet in Uganda decreases in all worlds. Therefore while food consumption is increasing, households are relying more on cereals and less on fruit and vegetables and meat. The fact that this effect is seen only in Uganda, points to population growth as the main driver of the reduction in diet quality as Uganda is projected to have the fastest growing population in the world over the coming years. The impact of these high population growth rates is reflected in the need to sustain the rapidly growing population with more but poorer quality foods.
Sustainability
Clear synergies and trade-offs exist between food security and environmental sustainability
Both modelling systems generally agree on the relative performance of the scenarios with respect to food security and environmental sustainability but important differences can also be observed. Exogenous yield improvement plays an important role in GLOBIOM in increasing food security, while in MAGNET this is much less the case.
Yield improvements are often described as win-win options supporting both biodiversity protection and food security. However, whether this effect can actually work in both directions, i.e. area-saving and consumption-increasing, is uncertain. The two modelling approaches here differ in how closely yield changes are coupled to consumption or area, respectively. In GLOBIOM, an increase in yields is mostly translated into lower prices and higher consumption, without much area-saving. Contrary, in MAGNET-IMAGE, yield increases lead to less area use, but only to about half of the a priori expected, due to feedbacks in the economic system with less substitution driven intensification, and also some consumption increase.
The effectiveness of protected areas for reducing biodiversity loss differs between the two modelling systems, as GLOBIOM still allows some agriculture in protected areas, similar to the current situation, and thus effectively protects less area than MAGNET-IMAGE. Both models agree that areas protected from agricultural expansion, even at high levels, do not result in significant reduction in agricultural area or biodiversity loss. There is still sufficient area available in most regions, and protection mostly leads to a displacement of agricultural expansion in the models. Only when protection levels approach the limits of land-availability, or when they are combined with measure reducing the demand for land, they help to reduce biodiversity loss. In the ECO scenario, where by design protected areas accompany high yield improvement, this leads to a decrease in agricultural area globally.
Conclusions
This study highlights the need for analysis that go beyond the global level. The regional analysis is a necessary complement to the global overview; taking into account regional differences to assess possible between country inequalities, and showing whether certain regions are at risk of being left behind. In addition, the household analysis – which is concerned with within country inequality in terms of FNS and whether improvements for the average household ‘trickle down’ to the poorest in each society – is another useful addition, providing more in-depth detail about the effects of certain policies on the poorest and therefore most food insecure households.
Our analysis shows that clear synergies and trade-offs can be identified between food security and environmental sustainability. Different assumptions made with regard to drivers such as agricultural productivity, land use change regulation and meat consumption show that win-win situations are possible. These win-win situations can occur when increases in agricultural productivity and reduction in animal product consumption are combined with nature conservation and spatial planning. They will not occur autonomously, but require the implementation of specific policies. These policies then can help strike a balance between FNS and environmental targets.
Acronyms
CAP - Common Agricultural Policy
CD - Cobb-Douglas
CDE - Constant Differences of Elasticity
CGE - Computable General Equilibrium
CH4 - Methane
CHN - China
CO2 - Carbon dioxide
EASIA - East Asia
EC - European Commission
ECO - Ecotopia (Scenario)
EPIC - Environmental Policy Integrated Climate Model
EU - European Union
FAO - Food and Agriculture Organization of the United Nations
FFANF - Food For All Not Forever (Scenario)
FNS - Food and Nutrition Security
GDP - Gross Domestic Product
GHA - Ghana
GHG - Greenhouse Gas
GLOBIOM - Global Biosphere Management (Model)
GTAP - Global Trade Analysis Project
IAM - Integrated Assesment Model
IDN - Indonesia
IIASA - International Institute for Applied System Analysis
IMAGE - Integrated Model to Assess the Global Environment
JRC - Joint Research Centre
LAC - Latin America and Caribbean
LPJmL - Lund-Potsdam-Jena managed Land (Model)
MAGNET - Modular Applied GeNeral Equilibrium Tool (Model)
MAGGIC - Model for the Assessment of Greenhouse Gas Induced Climate Change
MENA - Middle East and North Africa
N20 - Nitrous oxide
OECD - Organisation for Economic Co-operation and Development
ONEPW - One Percent World (Scenario)
PBL - Planbureau voor de Leefomgeving (Netherlands Environmental Assessment Agency)
PE - Partial Equilibrium
PPP - Purchasing Power Parity
ROW - Rest Of World
SDG - Sustainable Development Goals
SAM - Social Accounting Matrix
SASIA - South Asia
SSA - Sub-Saharan Africa
SSP - Socio-Economic Pathway
TLTL - Too Little Too Late (Scenario)
UGA - Uganda
WLD - World
WTO - World Trade Organisation
WUR - Wageningen University & Research
Bibliography
Armington, P., 1969. A theory of demand for products distinguished by place of production. International Monetary Fund Staff Papers. XVI, 159-78.
Alexandratos N and Bruinsma J (2012). World agriculture towards 2030/2050: the 2012 revision. FAO.
Biofuels Digest (2011). Biofuel mandates around the world.
Breisinger, Clemens, James Thurlow, and Magnus Duncan. 2007. ‘A 2005 Social Accounting Matrix (SAM) for Ghana’. Datasets. Ghana; Washington, D.C.: Ghana Statistical Services (GSS and International Food Policy Research Institute (IFPRI).
Burchi, F., J. Fanzo & E. Frison (2011). The Role of Food and Nutrition System Approaches in Tackling Hidden Hunger. International Journal of Environmental Research and Public Health, 8, 358-373. doi:10.3390/ijerph8020358
Dijk, M. van, and G.W. W. Meijerink. 2014. "A review of global food security scenario and assessment studies: Results, gaps and research priorities." Global Food Security 3 (3-4). Elsevier: 227–38. doi:10.1016/j.gfs.2014.09.004.
Dijk, Michiel van, Maryia Mandryk, Marc Gramberger, David Laborde, Lindsay Shutes, Elke Stehfest, Hugo Valin, and Katharina Zellmer. 2016. 'Scenarios to explore global food security up to 2050: Development process, storylines and quantification of drivers.' LEI Wageningen UR.
FAO (2016). Food security indicators.
Ganesh-Kumar, A. and M. Pamda (2009). A 2006-2007 Social Accounting Matrix for India. Unpublished mimeo. Indira Gandhi Institute of Development Research, Mumbai.
Havlík, P., Valin, H., Herrero, M., Obersteiner, M., Schmid, E., Rufino, M. C., Mosnier, A., Thornton, P. K.Böttcher, H., Conant, R. T., Frank, S., Fritz, S., Fuss, S., Kraxner, F. & Notenbaert, A. (2014),'Climate change mitigation through livestock system transitions', Proceedings of the National Academy of Sciences 111(10), 3709--3714.
Hertel, Thomas W., ed. 1997. Global Trade Analysis: Modeling and Applications. Cambridge University Press.
IFPRI. 2003. ‘Indonesia: Social Accounting Matrix, 1995’. Washington, DC: International Food Policy Research Institute.
IIASA. 2015. ‘SSP Database’.
International Energy Association (2015). Energy Technology Perspectives.
Kuiper, Marijke and Shutes, Lindsay (2014) 'Expanding the household coverage of global simulation models: An application to Ghana'. FoodSecure Technical Paper no.3.
Laborde, David, Simla Tokoz, Lindsay Shutes and Hugo Valin (2013). 'Assessment framework and operational definitions for long-term scenarios'. FoodSecure Working Paper no.14.
Lampe, Martin von, Dirk Willenbockel, Helal Ahammad, Elodie Blanc, Yongxia Cai, Katherine Calvin, Shinichiro Fujimori, et al. 2014. "Why do global long-term scenarios for agriculture differ? An overview of the AgMIP Global Economic Model Intercomparison." Agricultural Economics 45 (1): 3–20. doi:10.1111/agec.12086.
Lele, U., W. A. Masters, J. Kinabo, J.V. Meenakshi, B. Ramaswami & J. Tagwireyi with W.F.L. Bell and S.Goswami (2016). 'Measuring Food and Nutrition Security: An Independent Technical Assessment and User’s Guide for Existing Indicators' Technical Working Group on Measuring Food and Nutrition Security.
Nelson, Gerald C., and Gerald E. Shively. 2014. 'Modeling climate change and agriculture: an introduction to the special issue.' Agricultural Economics 45 (1): 1–2. doi:10.1111/agec.12093.
Nowicki P., van Meijl H., Knierim A., Banse M., Helming J., Margraf O., Matzdorf B., Mnatsakanian R., Reutter M., Terluin I., Overmars K., Verhoog C., Weeger C., Westhoek H., 2007. Scenar 2020 - scenario study on agriculture and the rural world. European Commission, Directorate-General Agriculture and Rural Development, Brussels.
Nowicki P., Hart K., van Meijl H., Baldock D., Banse M., Bartley J., van Bommel K., Helming J., Jansson K., Jansson T., Terluin I., van der Veen K. H., Verhoog P., Verburg D. , Woltjer G., 2009. Study on the impact of modulation. Contract No. 30–CE-0200286/00-21. European Commission, Directorate- General Agriculture and Rural Development, Brussels.
OECD. 2008. "Handbook on constructing composite indicators." OECD Publishing. doi:10.1787/533411815016.
O’Neill, Brian C., Elmar Kriegler, Kristie L. Ebi, Eric Kemp-Benedict, Keywan Riahi, Dale S. Rothman, Bas J. van Ruijven, et al. 2017. "The roads ahead: Narratives for shared socioeconomic pathways describing world futures in the 21st century." Global Environmental Change 42: 169–80. doi:10.1016/j.gloenvcha.2015.01.004.
PBL (2010) Rethinking Global Biodiversity Strategies: Exploring structural changes in production and consumption to reduce biodiversity loss. PBL Netherlands Environmental Assessment Agency.
Rosenzweig, C., J. W. Jones, J. L. Hatfield, A. C. Ruane, K. J. Boote, P. Thorburn, J. M. Antle, et al. 2013. 'The Agricultural Model Intercomparison and Improvement Project (AgMIP): Protocols and pilot studies.'' Agricultural and Forest Meteorology 170. Elsevier B.V.: 166–82.doi:10.1016/j.agrformet.2012.09.011.
Shutes, L. (Ed.), Michiel van Dijk, Frans Godeschalk, John Helming, Marijke Kuiper, Maryia Mandryk, Hans van Meijl, George Philippidis, Martine Rutten, Elke Stehfest, Andrzej Tabeau, Hugo Valin and Geert Woltjer. Toolbox 2050: Description of Linked Biophysical Modelling. FoodSecure Deliverable 7.2.
Stehfest, E., Berg, M., Woltjer, G., Msangi, S., Westhoek, H. (2013) Options to reduce the environmental effects of livestock production - Comparison of two economic models. Agricultural Systems 114, 38-53.
Takayama, T. & Judge, G. G. (1971), Spatial and temporal price and allocation models, North-Holland Amsterdam.
Thurlow, J. (2008). A 2007 Social Accounting Matrix for Uganda, International Food Policy Research Institute, Washington, D.C.
Vuuren, Detlef P. van, Keywan Riahi, Katherine Calvin, Rob Dellink, Johannes Emmerling, Shinichiro Fujimori, Samir KC, Elmar Kriegler, and Brian O’Neill. 2017. 'The Shared Socio-economic Pathways: Trajectories for human development and global environmental change.' doi:10.1016/j.gloenvcha.2016.10.009.
Williams, J. R. (1995), The EPIC model, in V. P. Singh, ed., , Water Resources Publications, , pp. 909--1000.
Woltjer, Geert, Marijke Kuiper, Aikaterini Kavallari, Hans van Meijl, Jeff Powell, Martine Rutten, Lindsay Shutes, and Andrzej Tabeau. 2014. ‘The MAGNET Model: Module Description’. LEI report 14-057. Wageningen: LEI - Wageningen UR.
Zhang, Yumei, and Xinshen Diao. 2013. ‘A 2007 Social Accounting Matrix for China: Methodology and Results’. Datasets. Washington, DC: International Food Policy Research Institute.
Key indicators
Compare the main indicators expressed as percentage changes between 2010 and 2050 for the 4 scenarios.

Radar
Time series
Map
Scatter
Sustainability
Household
This factsheet is also part of the FOODSECURE Navigator, an open-source knowledge tool for exploring diagnostics, future scenarios and guidance on policies for global food and nutrition security.
